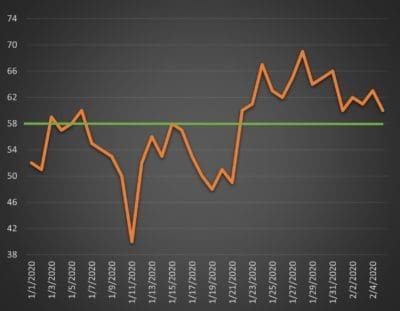
Run Chart
Open to access this content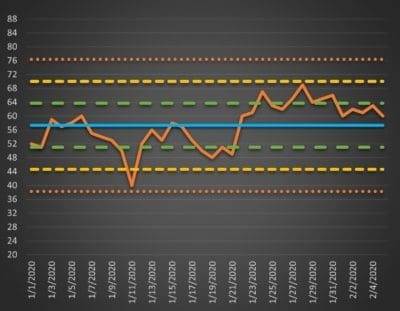
Control Chart
Open to access this content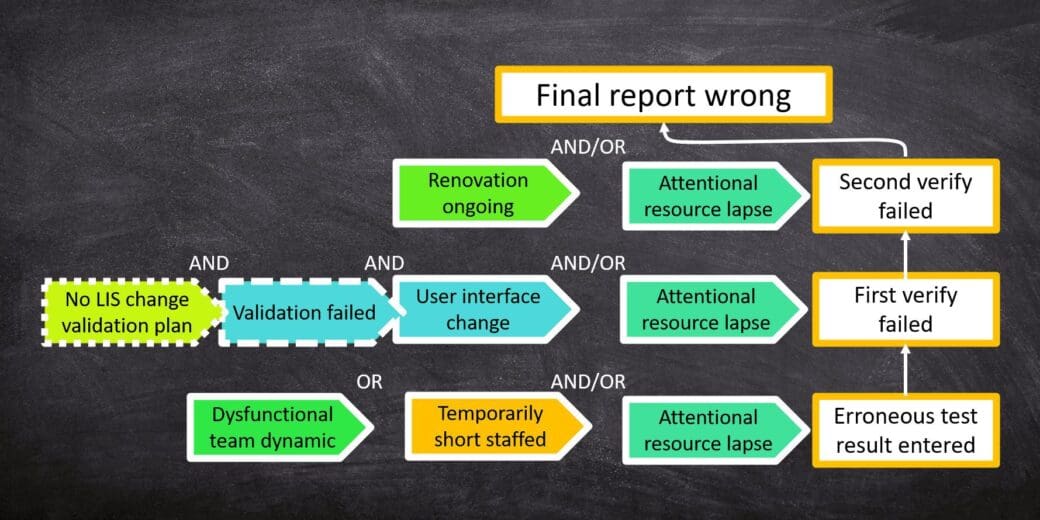
Causal Tree
Open to access this content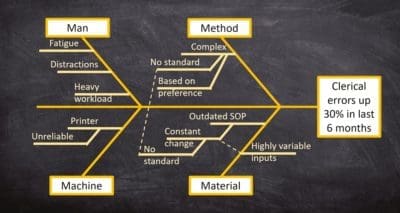
Fishbone Diagram
Open to access this contentDivi LMS Child Theme
