Fishbone Diagram
Price: Free
Description
Free Quality Tool Lesson!
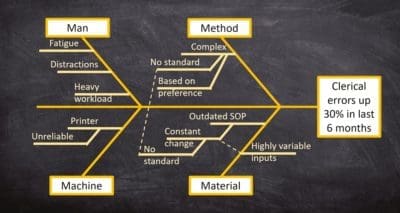
In this module, you will learn how to create and use one of the seven basic quality tools. This tool is called the cause and effect diagram or the Fishbone.
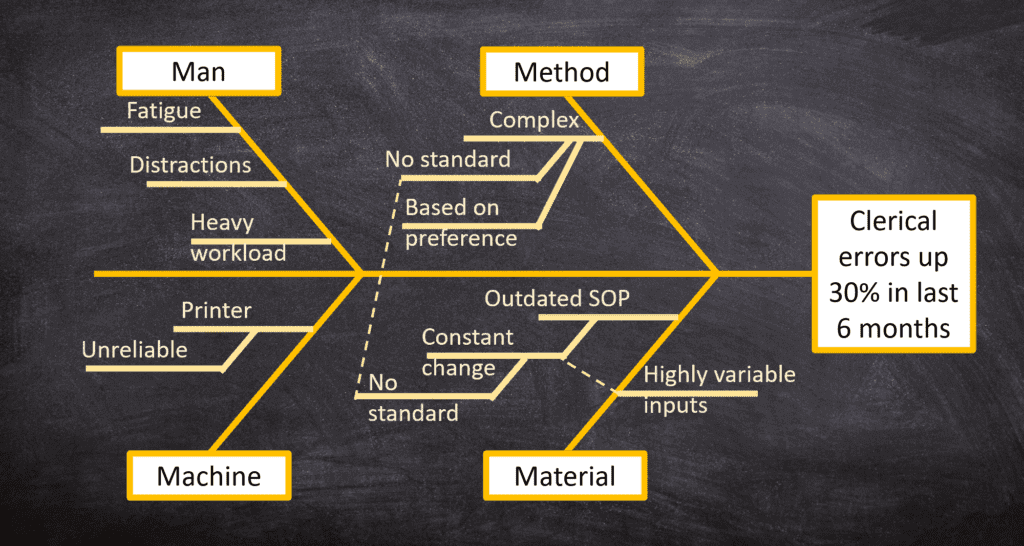
The Fishbone is used to discover the many causes of a single problem and to isolate those with the greatest effect..
This lesson includes:
One 11 minute video
References and resources for this course can be accessed in the Materials tab at the top of this page.
References and resources
Anderson, S. “Five types of fishbone diagrams.” Minitab: June 29, 2011. Retrieved from https://blog.minitab.com/blog/understanding-statistics/five-types-of-fishbone-diagrams. Accessed March, 2020.
International Symposium on Dr. Kaoru Ishikawa Birth Centenary. 2015. “Chapter 16: A collection of Dr. Ishikawa quotes.” Kaoru Ishikawa: the man and quality control. Retrieved from http://www.juse.jp/ishikawa/e/man/Ch16_Ver2_150717.pdf. Accessed March, 2020.
The Institute for Healthcare Improvement (IHI) provides a "QI Essentials Toolkit" that includes a section on creating an using a Fishbone in healthcare. There is a template for each of the featured tools that you can download and save to your computer. The template for the fishbone can be accessed here (you will need to register for the site):
http://www.ihi.org/resources/Pages/Tools/Quality-Improvement-Essentials-Toolkit.aspx
You must log in and have started this course to submit a review.